
Cricket Analytics for Club Teams: 5 Numbers That Actually Help You Win
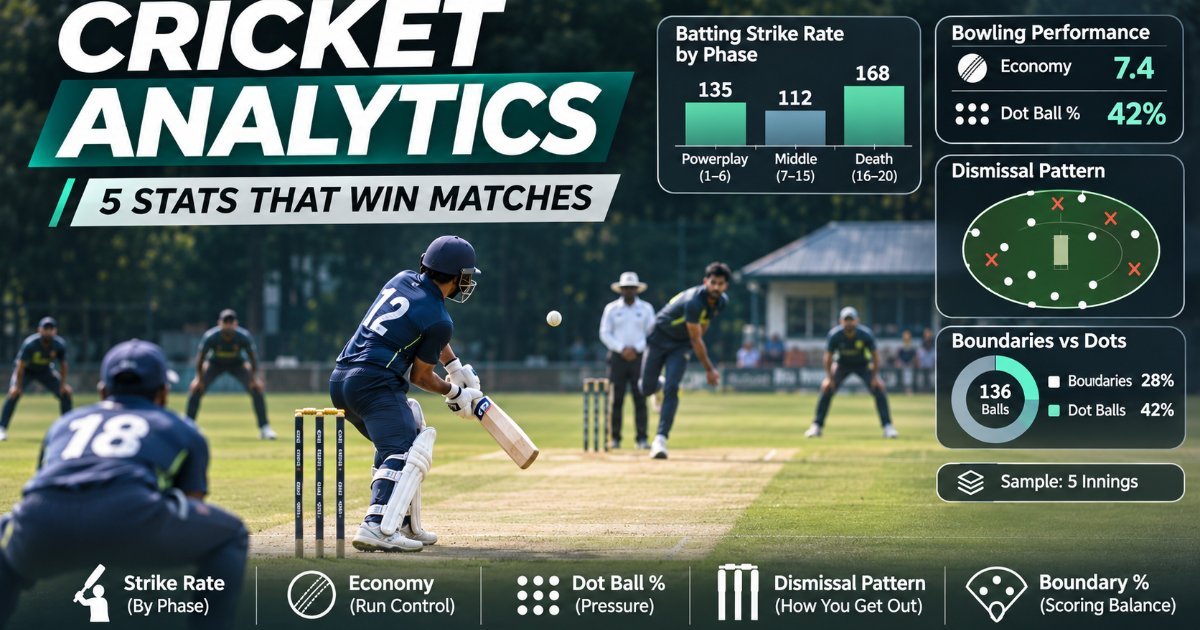
TL;DR: You do not need a data team to use cricket analytics. Track strike rate by phase, economy and dot-ball rate, dismissal patterns, boundary-to-dot ratio, and sample size. Use them to make three decisions, not to fill a dashboard.
The club's leading run-scorer can be the reason the team is losing.
That sounds harsh, but average hides a lot. A batter who scores 40 off 45 balls in the powerplay may be holding the innings back, while a player with a lower average who scores 30 off 18 can change the match.
Analytics is not about collecting more numbers. It is about picking the few that change a decision: who opens, who bowls the 18th over, which batter should face the spinner.
Why traditional averages mislead
Batting average answers one question: how many runs per dismissal? It does not tell you how quickly those runs came, or when they came.
Bowling economy answers another: runs per over. It does not tell you whether those overs were in the powerplay or at the death, or whether the bowler was taking wickets.
At club level, the sample is small. A player can have a great average after three innings and never repeat it. Context matters more than the headline number.
1. Strike rate by phase
Split the innings into three phases: powerplay, middle and death. Calculate strike rate for each.
Why? The same strike rate means different things in different phases. A 120 strike rate is respectable in the middle overs and slow at the death. A 150 strike rate in the powerplay is excellent; the same number in the middle may come with more risk.
Compare each batter to the team's par for that phase, not to a global average. A club team may not have the firepower of a professional side; the target should reflect the league.
Use it for: opening pairs, promotion or demotion in the order, and who should bat with five overs left.
2. Economy and dot-ball rate
Economy tells you runs per over. Dot-ball rate tells you how often the bowler builds pressure.
A bowler with an economy of 8.0 and a high dot-ball rate in the middle overs may be more valuable than a bowler with 7.0 and no dots, because the dots create wickets at the other end. A bowler who concedes boundaries but takes wickets at the death may still be worth his overs.
Track both by phase. A death bowler's economy of 9.5 may be fine if the league par is 10.5. Without context, the number is meaningless.
Use it for: bowling changes, who bowls the last over, and whether a part-timer is worth a full quota.
3. Dismissal patterns
How does each batter get out? How does each bowler take wickets?
A batter who is repeatedly caught at cover may have a scoring-zone weakness. A bowler who takes most wickets bowled and lbw may be effective with the new ball but less useful at the death.
Do not overfit to one dismissal. Look for a pattern across five or ten innings. Then use it for match-ups: who bowls to the opposition's best batter, and where the field should be.
Use it for: field placements, bowling match-ups, and pre-match plans.
4. Boundary-to-dot ratio
Count boundaries and dot balls for each batter. A player with many dots and few boundaries is putting pressure on the partner and forcing risky running.
This ratio is not a perfect stat, but it is a quick way to spot innings that look busy without actually scoring. A batter with 30 off 30 and six boundaries is different from 30 off 30 with one boundary and twelve dots.
Use it for: identifying who can accelerate and who needs a role change.
5. Sample size and context
A stat is only useful if you know how much to trust it.
Three innings is an anecdote. Five to ten innings in the same role is a trend. Death bowling needs more data because the variance is higher. A player who batted at number seven for two games is not comparable to an opener.
Track the context too: opposition strength, pitch, ground size, and whether the match was already decided. A 30-ball fifty in a dead rubber is not the same as one in a final.
Use it for: deciding when to act and when to wait.
How to collect the data without an analyst
You do not need a data department. You need ball-by-ball data.
- Use a scoring app that records every delivery, not just the final score.
- Export the scorecard or CSV after the match.
- Put the five numbers into a simple spreadsheet.
- Update the rolling averages after each game.
If you run a league, a platform can do this automatically. WicketNexus, for example, offers player insights such as scoring zones, dot and boundary control and dismissal patterns, plus compare and face-off tools. That is the same data a club analyst would collect, packaged for organizers. You can see the feature set at wicketnexus.com.
A simple weekly routine
Before the match: pick three match-ups from the data. One batting promotion, one bowling change, one field placement. Do not try to change everything.
After the match: ask three questions. Who scored faster than the team par in their phase? Who built pressure with dots? Which dismissal pattern hurt us?
Once a month: review selection. A player with good numbers in the wrong role may need a different job, not a drop.
Key Takeaways
- Average and economy hide tempo, phase and role.
- Strike rate and economy are more useful when split by phase.
- Dot-ball rate measures pressure, not just runs saved.
- Dismissal patterns turn data into match-ups and field plans.
- Do not trust a trend until you have enough innings in the same role.
Frequently Asked Questions
Do I need expensive software for cricket analytics?
No. Ball-by-ball data and a spreadsheet cover the five numbers in this article. A league platform automates the collection and reporting.
How many innings before a cricket stat is reliable?
At least five to ten innings in a similar role. Death bowling and lower-order batting need more because the samples are smaller and more variable.
What is the most overrated cricket stat?
Batting average without strike rate, and bowling economy without phase. Both hide the context that decides matches.
How did this story feel?
Be the first to react
Recommended gear
Popular tech picks

Samsung Galaxy S25 Ultra
6.9" AMOLED · 200MP · 5000mAh
Editor's pickView on Amazon →
Apple MacBook Air 13-inch (M4)
M4 · 16GB · 13.6" Liquid Retina
Editor's pickView on Amazon →
Sony WH-1000XM5
Over-ear ANC · 30h battery
Best headphonesView on Amazon →Affiliate links: we may earn a commission at no extra cost to you.
Written by
TechPulse Team
The TechPulse editorial team publishes clear, practical technology guides. Every article is original and written to be understood — not just skimmed.
Comments (0)
No comments yet — start the conversation!
Keep reading

Browser Tricks Power Users Swear By
Skip the extensions. These built-in browser tricks — tab search, hotkeys, tab groups and Memory Saver — save real time every day.

Browser Tricks Power Users Swear By
You closed the wrong tab. Here's the shortcut that brings it back, plus five more browser tricks that make daily browsing faster.

Hidden Android Features Most People Never Find
Long-press your app icons. Check your notification history. Six built-in Android tricks that save real time — and the junk apps you can stop installing.