What Customer Support Data Reveals About Churn
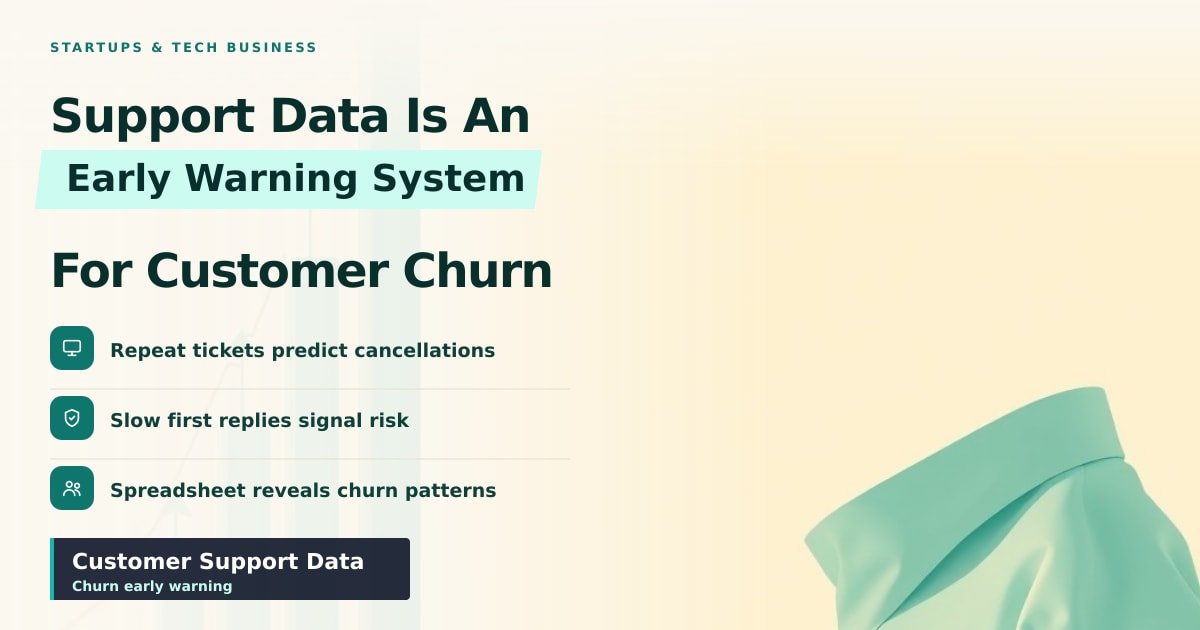
TL;DR: Customer support data is an early warning system for churn. Slow first replies, repeat tickets and "solved" problems that come back predict cancellations weeks before they happen. You can spot the pattern with a spreadsheet, no data team needed.
Your team closes 92% of tickets on time. The dashboard is green. Then a customer cancels, and you check their history: three tickets in six weeks, all marked "solved," none actually fixed. The warning was sitting in your support queue for a month. Nobody was reading it that way.
What churn means, in plain words
Churn is the share of paying customers who leave in a given period. If 2 of every 100 customers cancel in a month, your monthly churn rate is 2%. That sounds tiny. It isn't — at 2% a month you lose roughly a fifth of your customers in a year.
Support data matters because it's the only place unhappy customers talk to you before they leave. People rarely fill in a cancellation survey. They do send an email when the app breaks.
Four signals hiding in your ticket queue
Repeat tickets on one problem. One customer, three tickets, same issue. This is the strongest churn predictor most startups have, and it costs nothing to measure. Count tickets per customer per month and flag anyone above two.
Slow first reply. Customers judge whether you care by how fast someone answers, not by how fast you fix. A 30-hour first response on a bug reads as "we don't matter to them."
Asking for a manager. An escalation is a formal complaint. By that point the customer has already started wondering what else is out there.
Short, flat closing messages. "Fine." "Ok." "Whatever you think." The customer's word count drops before they cancel. Read ten of those messages and you'll spot the tone instantly.
How to read customer support data without a data team
Start with a spreadsheet, not a tool. Export your last six months of tickets, add a column for "cancelled within 90 days," and mark the people who left.
Then compare the two groups. Churned customers usually have more tickets per month, longer waits for a first reply, and more reopened issues. With 200 customers and 30 cancellations, you can see this by eye. No statistics degree required.
One warning: ticket volume alone can mislead. Big, happy accounts file more tickets because they use the product more. Look at the trend per account, not the raw total.
What this means for your startup this quarter
Pick three things and commit to them for 90 days.
- Set a first-reply target you can actually hit, like four business hours. Track the average, not your best day.
- Tag every ticket with a root cause, not just a product area. "Login loop" beats "mobile app."
- Email customers whose ticket was closed but who never confirmed it was fixed. One line: "Is this working now?"
One caution. Don't chase satisfaction scores alone. A five-star rating on a ticket nobody solved is worse than a three-star rating on a ticket you fixed, because it tells you to stop looking.
Key Takeaways
- Churn rate is the share of paying customers who leave each month; 2% a month loses about a fifth of your base in a year.
- Repeat tickets on the same issue are the clearest early warning of cancellation.
- A spreadsheet with a "cancelled yes/no" column is enough to find your own pattern.
- Track average first-reply time, not best case, and tag tickets by root cause.
Frequently Asked Questions
What is a good churn rate?
It depends on your market. Consumer subscriptions often run 3–7% a month, while business software contracts can sit under 1%. Compare against your own last quarter before you compare against anyone else.
How does customer support affect churn?
Support is where unhappy customers decide whether to stay. Fast first replies and problems that stay fixed build trust; repeat tickets and canned answers speed up the exit.
Which support metrics should a small startup track first?
Three are enough: average first reply time, tickets per customer per month, and the number of reopened or repeat tickets. Add a churn column and you have a real analysis.
Sources
- Investopedia — Churn Rate: https://www.investopedia.com/terms/c/churnrate.asp
- Harvard Business Review — The Value of Keeping the Right Customers: https://hbr.org/2014/10/the-value-of-keeping-the-right-customers
- Zendesk — Customer Service Benchmark: https://www.zendesk.com/benchmark/
How did this story feel?
Be the first to react
AI assistance. This article was researched and drafted with AI tools and reviewed by our editorial team before publication. We link to sources at the end of every article so you can verify the claims. If you spot an error, please let us know.
Recommended gear
Related picks for this guide

Paddle (Startup pricing)
Payments · tax · 5% + $0.50
Growth enablerView offer →Linear (Startup plan)
Issue tracking · roadmaps · 25 users
Ship fasterView offer →Affiliate links: we may earn a commission at no extra cost to you.
Weekly tech brief
The tech stories worth your time, every Sunday.
One short email with the most useful guides and gadget picks from the week. No spam, unsubscribe anytime.
Written by
TechPulse TeamThe TechPulse editorial team publishes clear, practical technology guides. Every article is original and written to be understood — not just skimmed. Read our editorial policy.
Comments (0)
No comments yet — start the conversation!
Keep reading

Pricing Page Design: Why Buyers Get Confused
TL;DR: Most pricing pages confuse buyers because they hide the real cost, mix seats with credits, and make people do math. In 2026, AI addons and usagebased…

Why Small Teams Ship Faster in 2026
A 12-person startup can now outship a 200-person competitor. Here's why AI tools and fewer meetings make the difference in 2026.

How Tech Support Becomes Your Best Feedback Loop
Your support inbox is already full of free research. Here's how one small team turned three weeks of tickets into a product fix — and how you can copy it.