
App Monitoring That Catches Trouble First
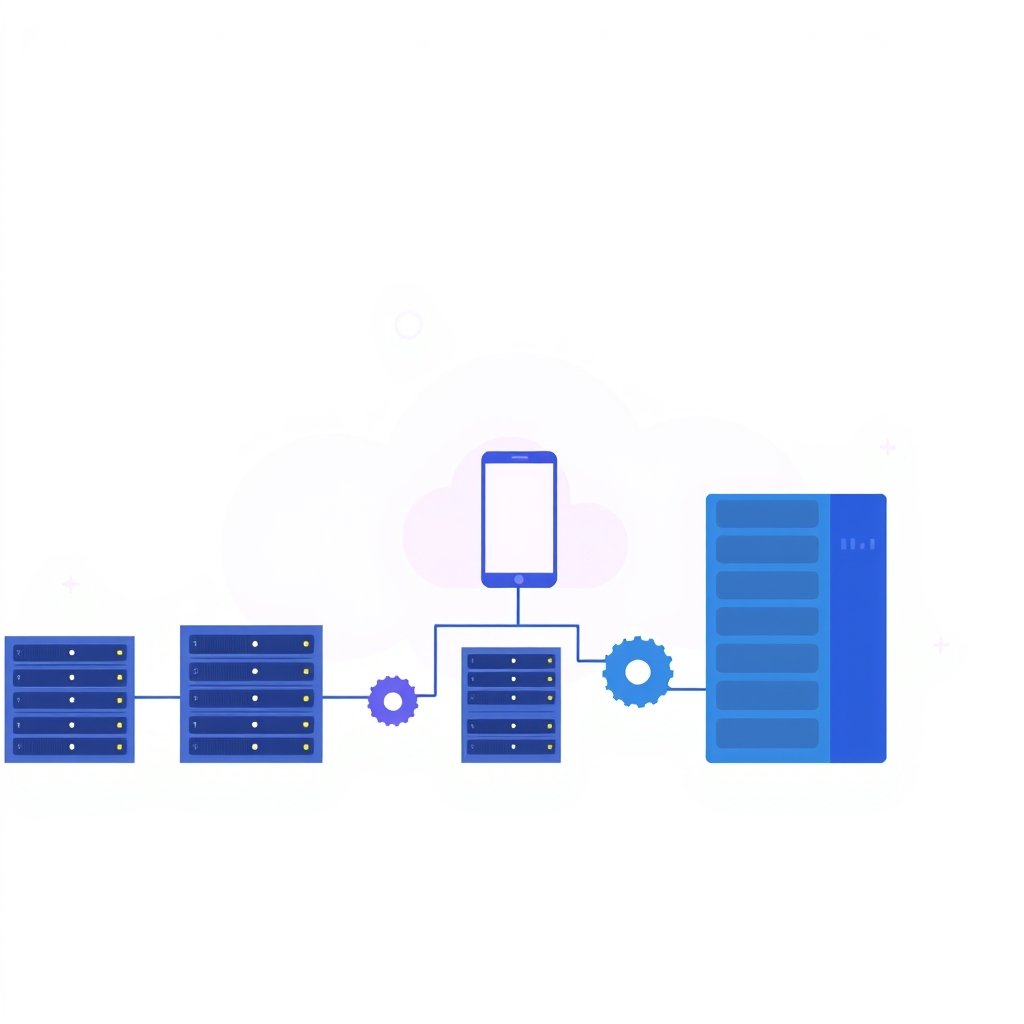
TL;DR: Set up app monitoring before launch by instrumenting the critical user path, alerting on symptoms like latency and error rate, and testing those alerts in staging. In a recent small SaaS project, OpenTelemetry plus Prometheus, Grafana, Sentry, and k6 caught a slow checkout query before any customer emailed support.
Last spring, a friend's checkout page went from 300 ms to 4 seconds after a harmless-looking database migration. Nobody complained. Users just left. That's the nasty part: silent abandonment looks like a quiet Tuesday in your dashboards. App monitoring is how you monitor your app before users complain — and before revenue leaks.
App Monitoring Starts With One Critical Path
Don't instrument everything on day one. Pick the path that pays the bills: sign-up, checkout, or the one API your biggest customer hammers. For this project — a two-person team's Node.js API on AWS ECS, Postgres on RDS, and a React frontend — checkout was obvious.
We tracked four things: p95 request latency, 5xx rate, database connections, and failed Stripe webhooks. That's it. A Grafana row with those signals told us more than a wall of CPU charts (which mostly tell you when a server is bored).
Alerts Should Catch Symptoms, Not CPU
Here's my bias: alert on what users feel. A CPU spike that doesn't slow requests is noise. A p95 checkout latency above 1 second for five minutes is a problem. For SLO monitoring, write the alert in plain language first: "Checkout succeeds 99% of the time under 1 second." Then reverse-engineer the metric.
We used OpenTelemetry instrumentation in Node, sent metrics to Prometheus via the Collector, and shipped dashboards to Grafana. Sentry handled exceptions with stack traces. Prometheus Grafana alerts went to Slack; only payment failures paged us. That split saved us from 2 a.m. alert fatigue.
Warn about one trap: don't buy a giant observability suite before you know your signals. Cloud monitoring tools are easy to add and hard to tame. Start small, then scale.
Test Alerts Like You Test Code
An untested alert is a rumor. Before launch, we ran a k6 load test against staging and watched p95 climb. Then we killed a Postgres connection pool, forced a 500 from the checkout endpoint, and sent a fake failed Stripe webhook. Every alert fired. The Slack message included the dashboard link and runbook.
Do this in staging, not production. If you're on Kubernetes, add pod restart and readiness probe failures to the list, but keep Kubernetes monitoring separate from user-facing symptoms. Cluster health explains the why; checkout latency tells you whether to wake someone.
Key Takeaways
- Monitor the revenue path first: latency, errors, DB saturation, failed webhooks.
- Alert on user symptoms and SLO breaches, not every CPU spike.
- Test alerts in staging with load tests and forced failures.
- Keep paging for payment or login failures; Slack for the rest.
Frequently Asked Questions
What should I monitor first in a new app? The critical user path: sign-up, login, checkout, or your busiest API. Track p95 latency, 5xx rate, and its main dependency.
How do I stop alert fatigue? Page only for user-facing failures or SLO breaches. Send everything else to a Slack channel with a dashboard link.
Do I need Prometheus and Grafana? Not always. They're a solid open-source pair, but managed services work too. The important part is tested alerts, not logo count.
How did this story feel?
Be the first to react
Written by
TechPulse Team
The TechPulse editorial team publishes clear, practical technology guides. Every article is original and written to be understood — not just skimmed.
Comments (0)
No comments yet — start the conversation!
Keep reading
What Is Kubernetes — And When Do You Actually Need It?
Kubernetes solves a real problem — just not the one most small teams have. Here's how to tell which side of the line you're on.

A Hybrid Cloud Strategy That Survives Real Workloads
Most hybrid cloud plans fail on the invoice, not the tech. Here's how to decide what stays on-prem, what gets rented, and what to leave alone.
Multi-Cloud Strategy: Smart Move or Complexity Trap?
Multi-cloud is either leverage or a very expensive habit. Here's how to tell which one you're building — and what the egress fee and VMware shake-ups actually change.