
OpenTelemetry Observability, Minus the Hype
It's 2:47 a.m. and your phone is buzzing: checkout latency just tripled. You open three dashboards, a log tool, and a tracing UI that uses a different naming convention for every service. Forty minutes later you find it — one downstream dependency, one bad deploy. The data was all there. It just didn't talk to each other.
That's the gap OpenTelemetry observability is built to close. It's also the place where most teams stumble, because a spec doesn't fix your naming conventions for you.
What is OpenTelemetry, in plain English
OpenTelemetry (OTel) is a vendor-neutral set of APIs, SDKs, and a data protocol for emitting telemetry from your code. It was born in 2019 when OpenTracing and OpenCensus — two competing projects — merged under the CNCF umbrella. Instead of every vendor shipping its own agent and its own proprietary format, you instrument once and ship anywhere.
Here's the part people undersell: OTel isn't a backend. It doesn't store anything. It's the pipe and the language.
| Signal | Question it answers | Where it stands |
|---|---|---|
| Traces | Where did this request go, and where did it stall? | Mature |
| Metrics | Is the system healthy right now, at scale? | Mature |
| Logs | What exactly happened in this one case? | Stable, still uneven across SDKs |
| Profiles | Which function is burning CPU? | Still settling |
The glue is OTLP, the OpenTelemetry Protocol. Anything that speaks OTLP — a Collector, a vendor endpoint, Prometheus, a cloud provider — can accept your data. That's the whole trick.
Three real-world patterns worth stealing
I've watched this play out across enough teams that the lessons have stopped surprising me. None of these require a rewrite.
1. The bug that only broke in one country
A payments team I worked with had a p95 latency spike that showed up on every dashboard and matched nothing in the logs. Turned out the issue only hit traffic from one region, and their metrics were aggregated so hard the region label was gone before the data hit the backend.
The fix wasn't exotic. It was a resource attribute.
# What went into the SDK's resource config
service.name: checkout-api
deployment.environment: prod
cloud.region: ap-south-1
Resource attributes ride along with every span and metric the SDK emits. Once cloud.region was attached at the source, filtering by region in the trace view took ten seconds. No new dashboards, no new tooling.
The takeaway: instrumentation is a data-model decision. If your labels are wrong at the SDK, no backend will save you.
2. The Collector trimmed the bill in a week
Here's the pattern I recommend most often, and it costs nothing but a config file: put an OpenTelemetry Collector between your apps and your vendor.
The Collector is a standalone pipeline — receivers in, processors in the middle, exporters out. In one 40-service shop, roughly a third of all spans were Kubernetes liveness and readiness probes hitting /healthz. Nobody had ever looked at them. A few lines of config dropped them.
processors:
  filter/health:
    error_mode: ignore
    traces:
      span:
        - 'attributes["http.route"] == "/healthz"'
  tail_sampling:
    decision_wait: 10s
    policies:
      - name: errors
        type: status_code
        status_code: {status_codes: [ERROR]}
      - name: slow
        type: latency
        latency: {threshold_ms: 500}
      - name: baseline
        type: probabilistic
        probabilistic: {sampling_percentage: 5}
Two processors, and the story changes: keep every error, keep every slow request, sample the boring 95%. That's tail sampling — you decide after the trace is complete, not before. It's the single biggest lever for trace spend, and it only works if the whole trace passes through the same Collector instance.
Use an agent on each node and a gateway layer behind it. The gateway is where tail sampling, redaction, and routing belong.
3. Drop the PII before it leaves the cluster
A quick warning, because I've seen this go wrong. Someone adds db.statement or http.request.header.authorization to the span attributes for "debugging" and it silently lands in a SaaS backend for 90 days.
Fix it in the Collector, not in nine codebases:
processors:
  attributes/scrub:
    actions:
      - key: http.request.header.authorization
        action: delete
      - key: db.statement
        action: hash
Treat the Collector as a security boundary. If you only remember one thing from this post, make it that one.
OpenTelemetry vs Prometheus isn't a fight
This question comes up constantly, and the framing is wrong. Prometheus is a metrics database with a query language and alerting. OpenTelemetry is the instrumentation layer. They overlap at the edges and mostly complement each other.
Prometheus 3.0, released in November 2024, shipped with an OTLP receiver. That means you can point OTel SDKs straight at Prometheus without an exporter shim. Grafana's Alloy is an OTel Collector distribution that replaced the older Grafana Agent, so the Grafana stack is OTLP-first now too. Your existing PromQL and alert rules don't have to move.
Two honest caveats:
- Watch cardinality. OTel makes it trivially easy to attach ten labels to a metric. Prometheus will happily store all of them and then fall over. Put a metric filter in the Collector and cap labels before ingestion.
- Don't send everything everywhere. Traces to your APM tool, metrics to Prometheus, logs to your log store — with one pipeline config. That's the point.
The bill is the real boss fight
Observability pricing is where the enthusiasm usually dies. At list prices, a per-host APM product like Datadog's sits around $31 per host per month billed annually, custom metrics are billed per metric series, and log ingest is priced by volume. Forty hosts and a metrics-heavy service, and you're having a very different conversation with finance.
Three things actually move the needle:
- Sample at the source for high-volume services, then tail sample at the gateway for the ones that matter.
- Filter in the Collector, not in the vendor's UI. You can't query what you refused to ship, and you shouldn't ship what you'll never query.
- Separate retention tiers. Keep 30 days of traces searchable and 12 months of aggregated metrics. Very few teams need a year of full-fidelity spans.
My opinion: instrument everything, export selectively. Instrumentation is a one-time cost that compounds in value. Export volume is a recurring cost that compounds against you.
Where observability is heading next
A few trends I'd bet on over the next couple of years.
Profiles become the fourth signal. Traces tell you a service was slow; profiles tell you which function inside it was slow. OTel has a profiles signal in development, and once it's correlatable with traces out of the box, the "we need a separate continuous profiler" line item gets harder to justify.
Semantic conventions stabilize into a real contract. Once http.* and db.* attributes are stable across every SDK and every backend, dashboards and alerts become portable. That's a bigger deal than it sounds — it's the difference between switching vendors in a quarter and switching in a year.
eBPF removes the "we'll instrument it later" excuse. Grafana's Beyla was donated to OpenTelemetry and now lives on as OpenTelemetry eBPF Instrumentation, giving you traces and RED metrics for services you can't or won't touch. Great for legacy. Not a substitute for real instrumentation in your own code — attributes you care about, like tenant ID, still have to come from your app.
Telemetry governance becomes a job. Someone has to own cardinality budgets, PII rules, sampling policy, and pipeline config as code. If that someone doesn't exist on your team, your observability bill is unmanaged by default.
And a mild caution about the AI-assisted debugging wave: copilots are only as good as the telemetry they reason over. Clean resource attributes and consistent span names get you real answers. Inconsistent naming gets you confident nonsense.
Key Takeaways
- OpenTelemetry is the instrumentation and transport layer — it doesn't store data, so pick your backend separately and deliberately.
- Attach business-relevant resource attributes (region, tenant, environment) at the SDK. Fixing labels later is painful and sometimes impossible.
- Run the Collector. Filter health checks, scrub PII, tail sample errors and slow requests — it's a config change, not a migration.
- Prometheus 3.0 accepts OTLP natively, so "OpenTelemetry vs Prometheus" is a false choice.
- Costs come from cardinality and volume, not from OTel itself. Control both in the pipeline.
- Instrument broadly, export selectively, and put governance somewhere on the roadmap.
Frequently Asked Questions
Is OpenTelemetry worth it for a small team?
Yes, if you're already paying for an observability backend. The SDK setup is an afternoon per service, and the Collector gives you vendor portability you'll want the day your bill doubles. If you're a three-person startup running one monolith, structured logs and a hosted APM tool are perfectly fine for now.
Does OpenTelemetry replace Prometheus?
No. OpenTelemetry instruments your code and moves the data; Prometheus stores and queries metrics. Prometheus 3.0 can ingest OTLP directly, so most teams end up running both, with the Collector routing metrics to Prometheus and traces to an APM backend.
How much does OpenTelemetry cost to run?
The project itself is open source and free. You pay for the backend you export to and for the compute running Collectors. In practice, the second cost is tiny compared to the first, which is why sampling and filtering in the pipeline matter so much.
How did this story feel?
Be the first to react
Written by
TechPulse Team
The TechPulse editorial team publishes clear, practical technology guides. Every article is original and written to be understood — not just skimmed.
Comments (0)
No comments yet — start the conversation!
Keep reading
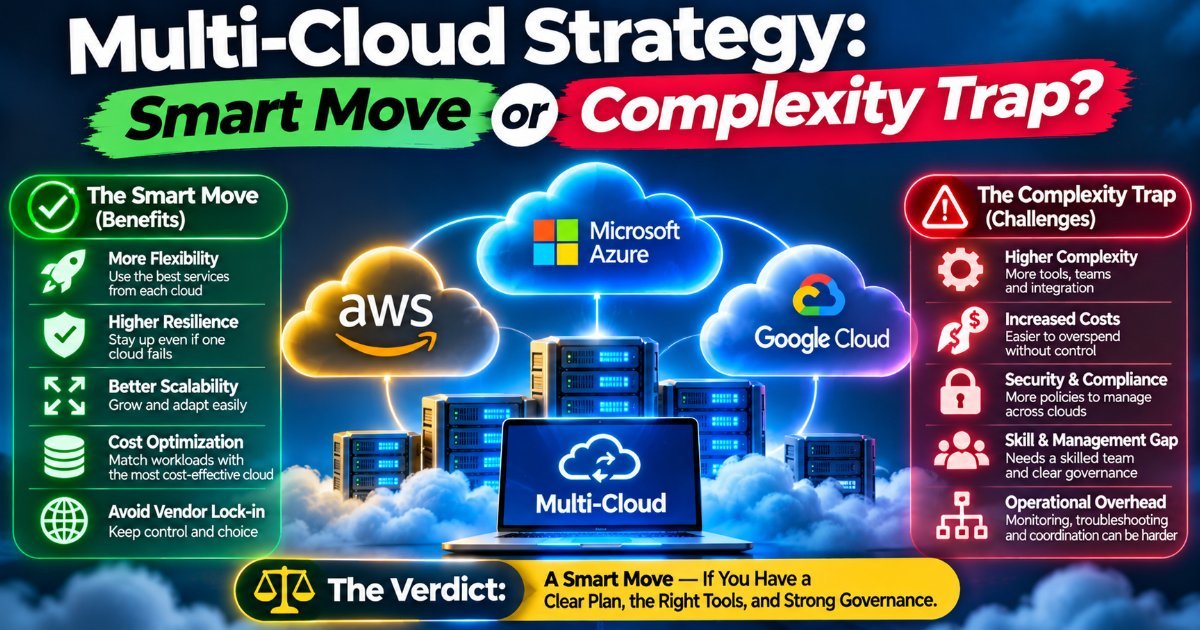
Multi-Cloud Strategy: Smart Move or Complexity Trap?
Multi-cloud is either leverage or a very expensive habit. Here's how to tell which one you're building — and what the egress fee and VMware shake-ups actually change.

Feature Flags: Cheap Insurance for Every Release
Feature flags aren't about toggles — they're about shrinking the blast radius of every change. Here's what the current trends mean in practice.
Multi-Cloud Strategy: The Complete Checklist Before You Commit
Multi-cloud isn't for everyone. Our checklist shows when it pays off — and when it's a complexity trap that costs you money and sleep.